Most ecommerce brands have email flows turned on. Welcome series, abandoned cart, maybe a post-purchase sequence. The problem is not that these flows are missing. The problem is that they generate a fraction of what they should because nobody built them with revenue data in mind. At Interconnections, we rebuilt the email flow architecture for an outdoor tools brand with a 14,000+ subscriber list and took revenue per recipient from $0.09 to $0.19, a 2.1x improvement, while their placed order rate doubled. This article breaks down the five ecommerce email marketing flows every store needs, the benchmarks each should hit, and the segmentation system that makes the difference.
The Five Ecommerce Email Marketing Flows That Drive Revenue
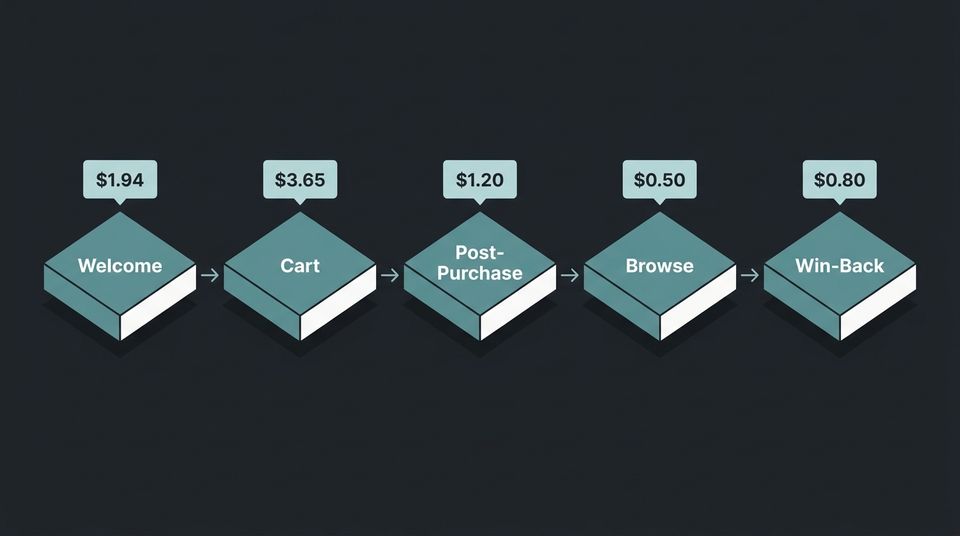
Automated email flows earn 18x more per recipient than campaigns, averaging $1.94 per recipient versus $0.11 for one-time sends. Flows account for just 5.3% of total email volume but generate nearly 41% of total email revenue. Those numbers come from Klaviyo’s dataset of 183,000+ brands, and they tell you exactly where your email investment should go.
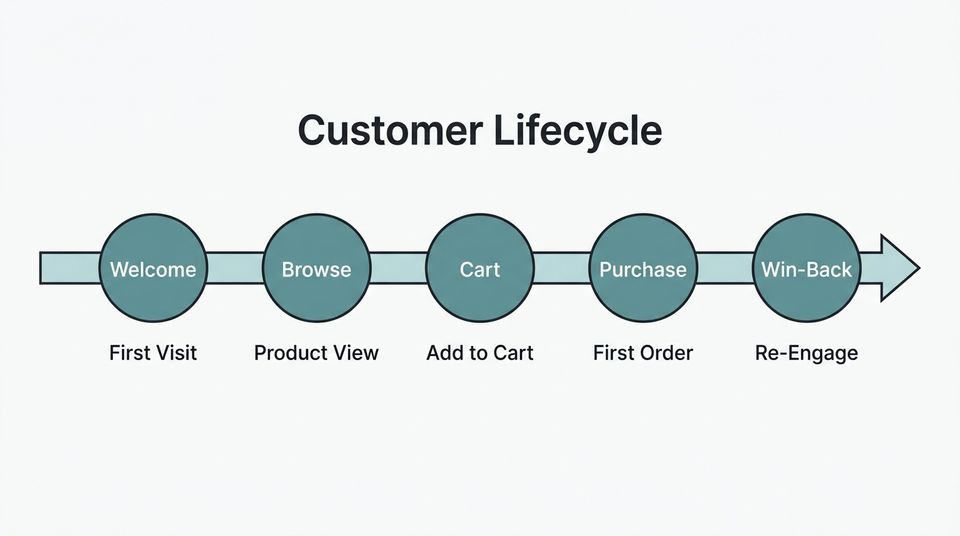
The five flows that matter most for ecommerce brands doing $1M to $10M in revenue are welcome series, abandoned cart, post-purchase, browse abandonment, and win-back. Every store has some version of these. The gap between a flow that exists and a flow that performs comes down to timing, segmentation, and specificity. If you want the full priority framework for which flows to build first and which to optimize later, read about the three-tier framework for building email flows in priority order.
Welcome Series: The Flow That Sets Your Email Revenue Ceiling
The welcome series is the highest-open-rate flow in your entire email program, with averages between 45% and 50% open rates across ecommerce. It is also the flow most brands waste by sending a single discount code and calling it done.
A welcome series for a $1M to $10M DTC brand should be three to five emails over seven to ten days. Email one sends immediately after signup and delivers whatever incentive you promised, typically 10% to 15% off. Email two arrives 24 hours later and tells the brand story with social proof. Email three at 72 hours introduces your best-selling products. If you extend to four or five emails, add educational content and a stronger offer for non-converters.
The revenue benchmark to watch is not open rate. It is placed order rate from the welcome flow. Top-performing ecommerce welcome flows convert at 3% to 5% of recipients into first-time buyers. If yours is below 2%, the issue is usually one of three things: your incentive is too weak for your price point, your email timing has gaps longer than 48 hours between sends, or you are sending the same message to popup subscribers and checkout opt-ins when those audiences need completely different sequences.
Abandoned Cart Flow: The Highest-ROI Automation in Ecommerce
Abandoned cart flows average $3.65 in revenue per recipient, making them the single highest-revenue automated flow for most ecommerce stores. Top 10% performers hit $16.96+ per recipient. The gap between average and top-tier performance is almost entirely explained by segmentation and timing.
The standard abandoned cart sequence is three emails. Email one sends 1 to 4 hours after abandonment with a reminder and the cart contents. Email two arrives 24 hours later with social proof or urgency. Email three at 48 to 72 hours includes a discount if the brand uses incentives. This timing works for most price points, but brands with an AOV above $200 (like the outdoor tools brand we worked with at Interconnections, which had a $278 AOV) should extend the window because high-ticket purchase decisions take longer.
The mistake most brands make is sending the same abandoned cart email to everyone. A first-time visitor who abandoned a $40 product needs a different message than a repeat customer who abandoned a $400 product. Segment by customer status (new versus returning), cart value (above and below your AOV), and product category. This segmentation alone can double your placed order rate from abandoned cart flows.
Post-Purchase Flow: Where Repeat Revenue Starts
The post-purchase flow is not a thank-you email. It is a revenue system that determines whether a first-time buyer becomes a repeat customer or disappears. Brands with strong post-purchase flows see 40% to 45% open rates on these sequences, which signals genuine customer engagement.
Structure the post-purchase flow in four stages. Stage one (day 1 to 2) is order confirmation and shipping updates, which build trust. Stage two (day 5 to 7) is product education or usage tips, which reduce returns and increase satisfaction. Stage three (day 14 to 21) is a review request, which generates social proof for your other flows. Stage four (day 30 to 45) is a cross-sell or replenishment offer based on what they bought.
The metric that matters here is repeat purchase rate within 90 days. A healthy post-purchase flow should push 20% to 30% of first-time buyers toward a second order within that window. If yours is below 15%, you are either asking for the review too early (before the product arrives), skipping the education stage entirely, or sending generic cross-sells instead of recommendations based on their actual purchase.
Browse Abandonment and Win-Back: The Flows Most Stores Overlook
Browse abandonment flows target visitors who viewed products but did not add anything to their cart. These flows typically generate lower revenue per recipient than cart abandonment ($0.30 to $0.80 range) but apply to a much larger audience. The volume makes them significant.
The timing window for browse abandonment is shorter than cart abandonment. Send the first email 1 to 2 hours after the browse session ends. Include the products they viewed plus similar recommendations. Send a follow-up at 24 hours if they have not returned. Do not send a third email for browse abandonment. The intent signal is weaker than cart abandonment, and a third send typically hurts deliverability more than it helps revenue.
Win-back flows re-engage customers who have not purchased in 60 to 120 days. The trigger timing depends on your product’s natural repurchase cycle. A consumable brand should trigger at 45 to 60 days. A durable goods brand should trigger at 90 to 120 days. The win-back sequence is three to four emails over 30 days. Start with a "we miss you" message, follow with a product highlight, then offer an incentive, and finally move non-responders to a sunset segment. Win-back flows with a clear incentive in email two or three recover 3% to 5% of lapsed customers on average.
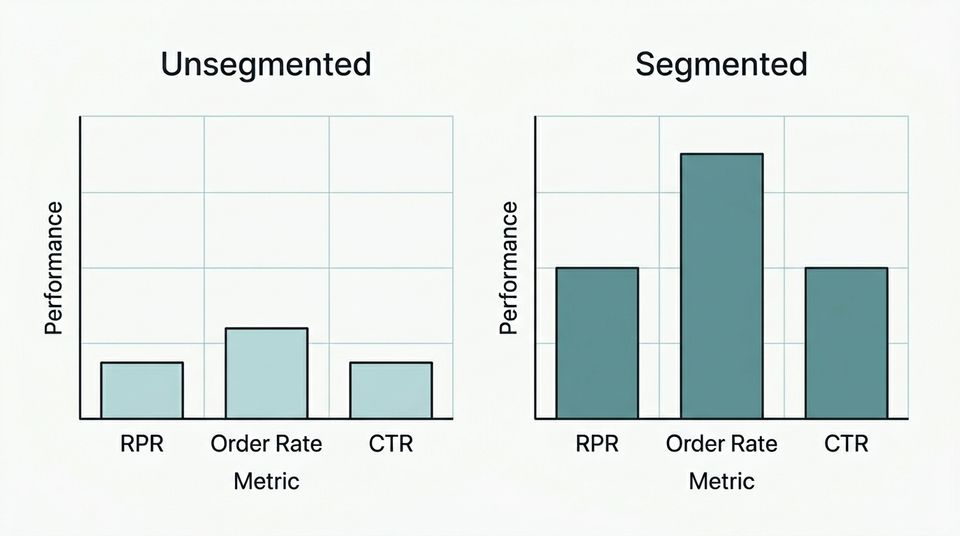
Email Segmentation Results: Outdoor Tools Brand
Before and after implementing a four-layer segmentation architecture on a 14,000+ subscriber list.
Unsegmented Email Program
All subscribers received the same flows and campaigns regardless of engagement, purchase history, or product interest.
- Revenue per recipient$0.09
- Placed order rate0.02%
- List size14,000+
- Average order value$278
Segmented Email Program
Four-layer segmentation by engagement recency, purchase history, product interest, and lifecycle stage.
- Revenue per recipient$0.19↑+111%
- Placed order rate0.04%↑+100%
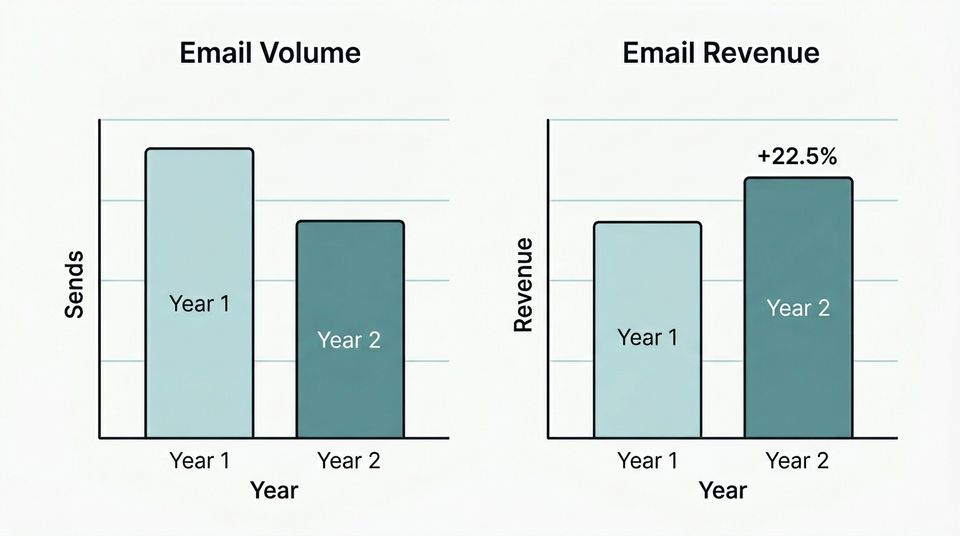
- BFCM revenue YoY+22.5%↑+22.5%
- Fewer total emails sentYes
Why Segmentation Doubles Ecommerce Email Revenue
Segmentation is the single largest lever for improving email flow performance, and it is the one most $1M to $10M brands ignore. At Interconnections, we rebuilt the segmentation architecture for an outdoor tools brand with a list of 14,000+ subscribers. The results quantify exactly what segmentation is worth.
Before segmentation, their revenue per recipient was $0.09. After implementing a segmentation system based on purchase history, engagement recency, and product interest, revenue per recipient increased to $0.19. That is a 2.1x improvement. Their placed order rate doubled from 0.02% to 0.04%. These are not theoretical numbers. They came from the same list, the same products, and the same brand. The only variable that changed was how the list was segmented and which messages each segment received.
The minimum viable segmentation architecture for ecommerce email has four layers. Layer one is engagement-based: 30-day active, 30 to 90-day engaged, 90-day+ inactive. Layer two is purchase-based: never purchased, one-time buyer, repeat buyer, VIP (top 10% by revenue). Layer three is product interest: based on browse and purchase history. Layer four is lifecycle stage: new subscriber, active customer, at-risk, lapsed. Most brands try to build all four layers at once and stall. Start with layers one and two. Those alone will change your flow performance measurably within 30 days.
BFCM Email Strategy: More Revenue From Fewer Sends
The conventional BFCM email playbook is to send more emails during the holiday period. This is wrong for most brands. During BFCM 2025, automations accounted for just 2% of email sends but drove 30% of revenue, earning 16x more per send than scheduled campaigns. The brands that win BFCM are not the ones sending the most. They are the ones whose automations are tuned for the moment.
At Interconnections, we ran the BFCM strategy for the same outdoor tools brand. The result was a 22.5% year-over-year increase in email revenue while sending fewer total emails than the previous year. The approach had three phases. Pre-BFCM (two weeks before): warm the list with early access teasers sent only to VIP and 30-day engaged segments. During BFCM: suppress the 90-day inactive segment entirely (they hurt deliverability and do not convert), increase abandoned cart flow frequency from 3 emails to 4 with tighter timing, and send campaigns only to engaged segments. Post-BFCM: run a stronger win-back flow targeting BFCM browsers who did not purchase.
The counterintuitive insight is that sending fewer emails to better segments produced more revenue. This is consistent with what the data shows across the industry. Click-to-conversion rates jumped 53% year over year during BFCM 2025, rising from 5.9% to 9%, because brands that segmented effectively reached buyers instead of flooding inboxes.
How Email Fits Into a Full-Funnel Ecommerce Marketing System
Email is not a standalone channel. It is the retention layer in a system where paid media drives acquisition and email converts that acquisition into repeat revenue. When Interconnections builds an ecommerce marketing system for a brand, email flows are calibrated alongside paid media spend, landing page conversion rates, and unit economics.
Here is why this matters in dollars. If a brand spends $50,000 per month on Meta ads and acquires customers at a $60 CAC, those customers need to place at least 1.5 orders on average to become profitable (assuming a $120 AOV with 40% contribution margin). The post-purchase and win-back flows are what drive that second order. Without them, the paid media spend is subsidizing one-time buyers who never return.
A well-built email program should generate 25% to 35% of total revenue for an ecommerce brand. If yours is stuck below 15%, the issue is almost always one of the structural problems covered in this article: missing flows, no segmentation, or generic templates that treat every subscriber identically. Understanding why your email program is stuck at 15% instead of 30% is the first step toward fixing it.
Common Ecommerce Email Marketing Mistakes
Sending the same email to your entire list. This is the most expensive mistake in email marketing. Unsegmented sends train inbox providers to deprioritize your emails. Open rates drop, deliverability declines, and revenue per recipient falls. Segmentation is not optional for brands past $1M in revenue.
Over-sending during peak periods. More emails does not mean more revenue. The BFCM data proves this conclusively. Brands that increased send volume without increasing segmentation quality saw flat or declining revenue per send. The fix is to send more to engaged segments and less (or nothing) to inactive ones.
Using generic templates without personalization. A cart abandonment email that says "you left something behind" with a stock photo converts at a fraction of the rate of an email that shows the exact product, includes the price, and references the customer’s purchase history. Personalization is not a design preference. It is a revenue variable.
Ignoring deliverability until it is a crisis. Every email you send to an inactive subscriber who does not open it damages your sender reputation. Sunset flows exist for a reason. If a subscriber has not engaged in 120 days, move them to a re-engagement sequence, and if that fails, suppress them. A smaller, healthier list generates more revenue than a large, unengaged one.
Frequently Asked Questions
How much revenue should ecommerce email flows generate?
Automated email flows should generate 25% to 35% of total ecommerce revenue for a well-optimized program. Flows earn an average of $1.94 per recipient compared to $0.11 for campaigns, according to Klaviyo’s 2026 benchmarks across 183,000+ brands. Interconnections targets 30% of total revenue from email for every ecommerce brand we work with.
What is the most important email flow for ecommerce stores?
The abandoned cart flow generates the highest revenue per recipient at $3.65 on average, with top performers reaching $16.96+. For brands just starting to optimize, Interconnections recommends building the abandoned cart flow first, followed by the welcome series, because those two flows capture the highest-intent subscribers.
How does email segmentation improve flow performance?
Segmentation typically doubles email flow performance. In one Interconnections case study with an outdoor tools brand, segmenting a 14,000+ subscriber list by engagement, purchase history, and product interest increased revenue per recipient from $0.09 to $0.19 (2.1x) and doubled the placed order rate from 0.02% to 0.04%.
How many emails should an abandoned cart flow have?
Three emails is the standard for most ecommerce brands: a reminder at 1 to 4 hours, social proof at 24 hours, and an incentive at 48 to 72 hours. Interconnections adds a fourth email during BFCM and for brands with AOV above $200, where the longer consideration window justifies an additional touchpoint.
What email metrics should ecommerce brands track beyond open rates?
Revenue per recipient (RPR), placed order rate, and click-to-conversion rate are the three metrics that actually correlate with email revenue. Open rates became unreliable after Apple’s Mail Privacy Protection changes. Interconnections uses RPR as the primary performance metric for every flow we build.
How should ecommerce brands adjust email flows for BFCM?
Suppress inactive segments entirely, tighten abandoned cart timing (send email one within 1 hour instead of 4), increase flow frequency for engaged segments only, and warm VIP and engaged segments with early-access teasers two weeks before the event. Interconnections achieved a 22.5% year-over-year BFCM revenue increase for one brand using this approach with fewer total sends.
If your email flows exist but underperform, the constraint is almost always segmentation, not volume. Before adding more sends or more flows, audit the four segmentation layers outlined above and measure revenue per recipient by segment. If you want a full diagnostic of where your email program is leaking revenue and how it connects to your paid media efficiency, that is exactly what Interconnections covers in how to evaluate an ecommerce marketing agency before signing a Growth Diagnostic Sprint.